Collaborators:
The entire class collaborated together to complete this experiment.
Introduction and Problem:
Acid rain consists of unusually acidic precipitation due to excess sulfur and nitrogen released by industries and transportation. According to Briney, acid rain occurs in the northeastern United States, southeastern Canada, and much of Europe: Sweden, Norway, and Germany. It forms when sulfur dioxide and nitrogen oxide from natural sources (volcanoes) and human-related sources (industries and transportation) react with water and oxygen in the atmosphere, forming sulfuric acid, ammonium nitrate, and nitric acid, thus increasing the acidity of the rain. Acid rain not only corrodes metals and deteriorates paint and stone, but according to the Environmental Protection Agency, acid rain also negatively impacts lakes, streams, and forests, as well as the flora and fauna that inhabit those ecosystems: As acid rain flows through soil in a watershed, aluminum is released from the soil, running off into nearby bodies of surface water and killing organisms with narrow tolerances to changes in pH and aluminum levels. In addition, acid rain -- although it does not directly kill trees -- damages tree leaves and dissolves essential nutrients and produces harmful chemicals in the soil. As a result, acid rain indirectly harms trees. According to the Environmental Protection Agency, a diminution in sulfur dioxide emissions from factories would greatly reduce acid rain. Farmers compensate for the loss of nutrients due to acid rain by adding fertilizers to the soil; they also add crushed limestone -- an alkaline rock -- to the soil to serve as a pH buffer. In conclusion, acid rain is a serious environmental issue for it affects each major "sphere" of the Earth. Through this lab, the question: "What is the effect of acid rain on fescue grass (and vegetation in general)?" will be addressed.
Hypothesis:
If three samples of fescue grass are exposed to water with a pH level of 2 (sample A) every other day for one week, two samples of fescue grass are exposed to water with a pH level of 4 (sample B) every other day for one week, and two samples of fescue grass are exposed to water with a pH level of 6 (sample C) every other day for one week, then the ones exposed to sample C will experience the most growth and be the healthiest, the ones exposed to sample B will experience less growth and be less healthy, and the ones exposed to sample A will experience the least growth and be the least healthy.
Parts of the Experiment:
- The independent variable consisted of the varying pH levels of the water to which the samples of fescue grass were exposed -- 2 and 4.
- The dependent variable consisted of the growth and health of the samples of fescue grass when they were exposed to the water with varying pH levels -- sample A and B.
- The controlled variables consisted of the materials of the experiment, the height at which each sample of fescue grass was cut, the amount of water to which each sample of fescue grass was exposed, the frequency at which each sample of fescue grass was watered, and the humidity of the classroom.
- The experimental group consisted of the three samples of fescue grass that were exposed to sample A -- the water with a pH level of 2 -- and the two samples of fescue grass that were exposed to sample B -- the water with a pH level of 4.
- The control group consisted of the two samples of fescue grass that were exposed to the sample C -- the water with a pH level of 6, the average pH of rainwater.
Materials:
- 7 empty, cut-open 2 L bottles
- potting soil
- fescue grass seeds
- scissors
- ruler
- tape
- Sharpie markers
- 7 graduated cylinders
- beaker of water with a pH level of 6
- bottle of water with a pH level of 2
- bottle of water with a pH level of 4
- acetic acid
- pH paper
- paper towels
Method:
- Obtain seven empty, cut-open 2 L bottles, fill them up with potting soil, and in them, plant fescue grass seeds.
- Allow the fescue grass samples to grow, then cut all of them to the same height. Label three of them "sample A", two of them "sample B", and two of them "sample C".
- Obtain seven samples of water from the teacher. Label three of them "sample A", two of them "sample B", and two of them "sample C", and measure their pH levels using strips of pH paper; record their pH levels.
- Pour 50 mL of sample A into three graduated cylinders, 50 mL of sample B into graduated cylinders, and 50 mL of sample C into two graduated cylinders.
- Water each sample of fescue grass with its corresponding sample of water.
- Repeat step 5 every other day for one week (a total of three times).
- Record qualitative data throughout the duration of the experiment.
Data:
|
|
Data Table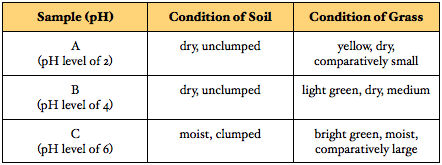
|
Data Analysis:
Pictures 4, 5, and 6 (above) show the condition of the seven samples of grass (samples A, B, and C) before they were exposed to their corresponding samples of water every other day for one week. The soil in each sample was moist and clumped; the fescue grass was green and moist.
Pictures 10 - 16, as well as the data table above, show the condition of the three samples of grass after they were exposed to their corresponding samples of water every other day for one week: Firstly, after being exposed to a sample of water with a pH of 2 (sample A) every other day for one week, the soil samples A became dry and unclumped; the fescue grass became yellow and dry, and was comparatively small. Secondly, after being exposed to a sample of water with a pH of 4 (sample B) every other day for one week, the grass in samples B also became dry and unclumped; the fescue grass became light green and dry, and was medium. Finally, after being exposed to a sample of water with a pH of 6 (sample C), the soil in samples C became moist and clumped; the fescue grass became bright green and moist, and was comparatively large.
Firstly, the condition of the soil and fescue grass in samples A indicates hindered, unhealthy plant growth. Secondly, the condition of the soil and fescue grass in samples B indicate moderately hindered, unhealthy plant growth. Finally, the condition of the soil and fescue grass in samples C indicate normal, healthy plant growth.
Conclusion:
The results of this experiment support the hypothesis: "If three samples of fescue grass are exposed to water with a pH level of 2 (sample A) every other day for one week, two samples of fescue grass are exposed to water with a pH level of 4 (sample B) every other day for one week, and two samples of fescue grass are exposed to water with a pH level of 6 (sample C) every other day for one week, then the ones exposed to sample C will experience the most growth and be the healthiest, the ones exposed to sample B will experience less growth and be less healthy, and the ones exposed to sample A will experience the least growth and be the least healthy." According to the pictures and data table above, the soil in samples A became dry and unclumped, while the fescue grass in samples A became yellow and dry, and was comparatively small; this indicates hindered, unhealthy plant growth. In addition, the soil in samples B also became dry and unclumped, while the fescue grass in samples B became light green and dry, and was medium; this indicates a moderately hindered, unhealthy growth. Finally, the soil in samples C became moist and clumped, while the fescue grass in samples C became bright green and moist, and was comparatively large; this indicates an unhindered, healthy growth.
According to the Environmental Protection Agency, the average pH level of acid rain is 4.0; therefore, samples B -- which were exposed to water with a pH level of 4 -- were the most accurate simulations of vegetation exposed to acid rain. The results of the experiment demonstrate that after the one week interval, the fescue grass in samples B experienced moderately hindered, unhealthy growth. The Environmental Protection Agency further corroborates the results of the experiment by offering a succinct, yet didactic explanation to the stunted growth experienced by the fescue grass in samples B: Acidic water dissolves and washes away (leaches) nutrients from the soil -- calcium, magnesium, and potassium. These nutrients are essential to plant growth, for they are used by plant cells to build new cells, transport sugars and water throughout the plant, and carry out photosynthesis. In addition, acidic water "can 'mobilize' aluminum ions which are normally present in an insoluble nontoxic form of aluminum hydroxide" (Ophardt, 2003). Aluminum hinders root growth and prevents them from absorbing calcium, therefore stunting plant growth. Finally, according to Ophart, the increased acidity of soil caused by acidic water is virulent to beneficial bacteria whose niche is to break down dead organic matter and return essential nutrients to the soil to be absorbed by plants; therefore, as the acidity of the soil increases, the population of beneficial bacteria, and therefore the amount of plant growth also decreases.
This experiment successfully simulated the effects of acid rain on vegetation. In conclusion, acid rain, which typically has a pH level of 4.0, has a negative, unhealthy impact on plant growth. It can also be concluded that precipitation with a pH level lower than 4.0 -- in this experiment, 2 -- has a greater, negative, unhealthy impact on plant growth, while precipitation with a pH level around 6.0 -- the average pH level of rainwater -- has a positive, healthy impact on plant growth. In addition, according to Briney, acid rain negatively affects not only vegetation, but also bodies of water, buildings, and living organisms. In order to preclude the plethora of problems associated with acid rain, humans must reduce harmful gas emissions -- most notably sulfur dioxide. "Many governments are now requiring energy producers to clean smoke stacks by using scrubbers which trap pollutants before they are released into the atmosphere and catalytic converters in cars to reduce their emissions. Additionally, alternative energy sources are gaining more prominence today and funding is being given to the restoration of ecosystems damaged by acid rain worldwide" (Briney, 2014). For example, limestone can be applied to bodies of water to neutralize the effects of acid rain, therefore restoring damaged ecosystems. In conclusion, as the world's environmental regulations become more stringent, our Earth becomes more healthy.
Citations:
"Acid Rain." EPA. Environmental Protection Agency, 10 Sept. 2014. Web. 22 Nov. 2014. <http://www.epa.gov/acidrain/>.
Briney, Amanda. "How Much Should You Worry About Acid Rain?" About. N.p., n.d. Web. 11 Nov. 2014. <http://geography.about.com/od/globalproblemsandissues/a/acidrain.htm>.
Ophardt, Charles E. "Acid Rain Effects - Soils." Acid Rain Effects - Soils. Elmhurst College, 2003. Web. 25 Nov. 2014. <http://www.elmhurst.edu/~chm/vchembook/196soil.html>.
