Collaborators:
Joshua Arteta and Raul Ponce
Introduction and Problem:
According to the background information, primary productivity is a measure of the amount of photosynthesis that an ecosystem undergoes. Gross primary productivity (GPP) is a measure of the total amount of organic energy converted from the sunlight that the producers of an area receives, while net primary productivity (NPP) is a measure of the amount of that energy remaining after the producers undergo cellular respiration. Net primary productivity is an important indicator of the health of an ecosystem: Generally, ecosystems with high net primary productivities - open oceans, estuaries, and tropical rain forests - are able to support wide ranges of species, leading to high levels of biodiversity. For example, grasslands have a relatively high net primary productivity that supports a wide range of species, including grasshopper, bison, buffalo, zebra, and bird ("What Eats Grass?"). Grass is an important producer that contributes to the net primary productivity of an ecosystem; therefore through this lab, the problem: "What is the net primary productivity of fescue grass?" will be addressed.
Pre-Lab:
Name some of the factors that can influence the productivity of an ecosystem.
Factors that can influence the productivity of an ecosystem include the amount of vegetation in that ecosystem, the amount of water and nutrients cycling through that ecosystem, and the amount of sunlight reaching the vegetation of that ecosystem.
Factors that can influence the productivity of an ecosystem include the amount of vegetation in that ecosystem, the amount of water and nutrients cycling through that ecosystem, and the amount of sunlight reaching the vegetation of that ecosystem.
Hypothesis:
If fescue grass seeds are planted and allowed to grow for 12 days, then they will have a net primary productivity slightly less than 58 g/cm^2/year, the known net primary productivity of fescue grass given by the background information.
Parts of the Experiment:
According to Molly Bostic, because this experiment was an observational experiment, it did not consist of any independent variables, dependent variables, controlled variables, control groups, or experimental groups. The group under observation consisted of each group's sample of fescue grass. After 12 days, the biomass of each group's grass samples were recorded, and the net primary productivity of each group's grass samples were calculated; these calculations were compared to the known net primary productivity of fescue grass provided by the background information, 58 g/cm^2/year. One factor that affected the biomass and net primary productivity of each sample included the amount of water each sample was exposed to. Finally, the amount of sunlight each grass sample received, the height at which each grass sample was cut, and the amount of time each grass sample was grown remained constant.
Materials:
- fescue grass seeds
- soil
- empty, cut-open two-liter bottle
- paper towels
- metric ruler
- scissors
- digital scales
Method:
1. Fill an empty, cut-open two-liter bottle with soil.
2. Plant a handful of fescue grass seeds in the soil.
3. Place a dampened paper towel over the soil.
4. Allow the grass to grow; after it does so, use scissors and a ruler to cut it to a height of 2 cm.
5. After 13 days, use scissors and a ruler to cut the grass to a height of 2 cm as before.
6. Carefully remove all the grass clippings. Allow them to dry for at least 2 days before weighing them using a digital scale.
7. Measure the area of the grass.
8. Record the data in the table and calculate the net primary productivity (NPP) using the following formula:
NPP = (Biomass/Area)/Day
9. Obtain the net primary productivity data from the other groups in your class. Then, calculate a class average for the net primary productivity for the fescue grass.
10. Compare the known net primary productivity of fescue grass, 58 g/cm^2/year, to the calculated average net primary productivity of fescue grass. Calculate the percent error of your calculation.
Data:PicturesClass Data Table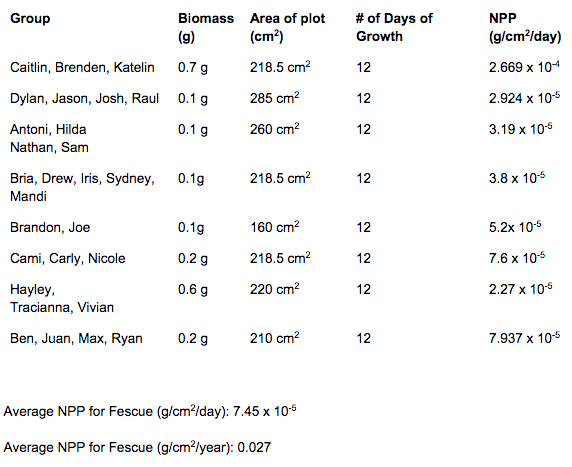
|
Data Analysis:After the class data had been organized using a table, the average net primary productivity of fescue grass was calculated to be 0.027 g/cm^2/year. This calculated net primary productivity of fescue grass greatly differs from the known net primary productivity of fescue grass, 58 g/cm^2/year given by the background information. This disparity between the results and the given net primary productivity most likely arose due to an inaccurate estimation of the known net primary productivity of fescue grass, imprecise measurements of the height at which the grass was to be cut, or a significant difference in the amount of water each group's grass sample was exposed to. However, it could also be a result of using an artificial environment that does not replicate the natural environment of fescue grass. These factors may have skewed the data, causing the net primary productivity calculations of each group to vary, ultimately skewing the calculated, average net primary productivity.
Compared to the class average, my group's data had a high percent error of 60.8 %. This disparity between my group's calculation and the average net primary productivity is imprecise measurements of the height at which the grass was to be cut, or a significant difference in the amount of water each group's grass sample was exposed to. These factors may have skewed the data, causing the net primary productivity calculations of each group to vary, ultimately skewing the calculated, average net primary productivity. There were two outliers in the data: Cami's group's calculation (7.6 x 10^-5 g/cm^2/day) and Ben's group's calculation (7.937 x 10^-5 g/cm^2/day) These outliers are most likely a result of imprecise measurements of the height at which the grass was to be cut: Groups whose samples were cut shorter had longer clippings, and therefore higher, calculated net primary productivities; groups whose samples were cut higher had shorter clippings, and therefore lower, calculated net primary productivities. These outliers could also be a result of a significant difference in the amount of water each group's grass sample was exposed to: Groups whose samples received less water had lower, calculated net primary productivities, while groups whose samples received more water had higher, calculated net primary productivities. They may have skewed the data, causing the calculated, average net primary productivity to be higher. |
Conclusions:
Conclusion Questions
1. Calculate the average NPP per day as well as the NPP for a year.
The average NPP for fescue grass is 7.45 x 10^-5 g/cm^2/day, and 0.027 g/cm^2/year.
2. Calculate your percent error based off the class average.
Based off the class average, the percent error of my group's calculation of the net primary productivity of fescue grass was 60.8 %, a very high percent error. This high percent error was most likely a result of a skew in the data due to confounding variables. For example, differences in the height at which each sample of grass was to be cut, and the amount of water to which each sample of grass was exposed among each group may have skewed the data, causing the net primary productivity calculations of each group to vary, ultimately skewing the calculated, average net primary productivity.
3. Was this a good model for testing net primary productivity? Why or why not?
In theory, this experiment is a good model for testing net primary productivity. By growing samples of fescue grass for twelve days, cutting it to a height of 2 cm, and measuring the amount of biomass produced and the area of the plot, the net primary productivity of fescue grass can be calculated. However, there are many confounding variables that can skew the data of the experiment and ultimately the calculated, average net primary productivity: Differences in the height at which each sample of grass is cut and the amount of water to which each sample of grass is exposed among each group can affect the results of the experiment. For example, during the experiment, one group did not precisely measure the height at which its grass was to be cut, while another group exposed its sample of grass to too much water. These factors most likely led to a skew in the data, ultimately invalidating the experiment, as supported by the high percent error of my group's calculations: 60.8 %.
4. Describe an experiment where we could test an environmental effect on net primary productivity. Be sure to list the effect tested.
By conducting an experiment, a scientist could test the effect of nutrient levels on the net primary productivity of vegetation. In this experiment, a scientist could expose ten samples of grass (experimental groups) to varying levels of nutrients (independent variable), including nitrogen, phosphate, potassium, and sulfur, and one sample of grass (control group) to no nutrients. After exposing these samples to a constant amount of sunlight and water (controlled variables) and allowing them to grow for a specific period of time, the scientist can then calculate the net primary productivity of each sample (dependent variable), ultimately determining the effect of nutrient levels on the net primary productivity of vegetation.
5. Why is understanding the primary productivity of an ecosystem important? To whom would this information be important?
The net primary productivity of an ecosystem is an important indicator of the health of that ecosystem. According to the background information, net primary productivity is the remaining chemical energy that is available to the consumers of an ecosystem; therefore, ecosystems with high net primary productivities are generally able to support a myriad of species. For example, the relatively high net primary productivity of grassland ecosystems support a plethora of species, including grasshopper, bison, buffalo, zebra, and bird ("What Eats Grass?"). Biodiverse ecosystems, like grasslands, have high genetic and species diversity; therefore, they are more resilient to environmental changes, such as natural disasters, and foster evolution, ultimately leading to a healthier ecosystem.
Net primary productivity would be important to a grassland agriculturist. The agriculturist would want to ensure that a sufficient amount of energy is flowing to each trophic level of the ecosystem's food chain; a high net primary productivity would support livestock and be economically lucrative. Net primary productivity would also be important to a national park officer. The officer would want also want to ensure that a sufficient amount of energy is flowing to each trophic level of the ecosystem's food chain; a high net primary productivity would support the endangered species living in the park, allowing their population size to grow. If the net primary productivity is low in any of these ecosystems, it would be important to determine its cause in order to address the problem as well as preclude any future ones.
Conclusion
The results of this experiment did not support the hypothesis: "If fescue grass seeds are planted and allowed to grow for 12 days, then they will have a net primary productivity slightly less than 58 g/cm^2/year, the known net primary productivity of fescue grass given by the background information". The class average net primary productivity of fescue was calculated to be 0.027 g/cm^2/year, significantly less than the known net primary productivity of fescue grass given by the background information.
This disparity between the two values most likely arose due to several factors. Firstly, the known net primary productivity provided by the background information may not have been an accurate estimation of the actual net primary productivity of fescue grass. Secondly, the artificial environment that the grass samples were exposed to may not have effectively replicated the natural environment of fescue grass. In order to achieve accurate results, the grass samples may have to be placed outside in their natural environment instead of in a classroom; this would allow them to receive a natural amount of sunlight and rain water. Finally, there were two outliers in the class data: Cami's group's calculation (7.6 x 10^-5 g/cm^2/day) and Ben's group's calculation (7.937 x 10^-5 g/cm^2/day). These outliers may have arose from confounding variables in the experiment. For example, during the experiment, one group did not precisely measure the height at which its grass was to be cut, while another group exposed its sample of grass to too much water. These factors most likely led to a skew in the calculated, average net primary productivity of fescue grass. Making revisions to the Net Primary Productivity Lab would yield more accurate results in future replications of the experiment.
In conclusion, net primary productivity is an important indicator of the health of an ecosystem. An ecosystem with a lot of vegetation has a high net primary productivity, and therefore can support a myriad of species since it can provide a sufficient amount of energy to organisms of each trophic level. An ecosystem with a relatively high net primary productivity is the grassland ecosystem, which can support a plethora of species: grasshopper, bison, buffalo, zebra, and bird ("What Eats Grass?" 2010). Net primary productivity would be important to a grassland agriculturalist who wants to ensure that a sufficient amount of energy is flowing to each trophic level of the grassland ecosystem's food chain, which would support livestock and be economically lucrative. Also, ecosystems with a lot of vegetation and high net primary productivities help mitigate the effects of global warming due to the burning of fossil fuels ("Net Primary Production" 2014). When plants undergo photosynthesis, they use sunlight to convert carbon dioxide from the air and water into oxygen and glucose. Therefore, ecosystems with high net primary productivities remove a lot of carbon dioxide from the air, converting it into oxygen and energy to support other organisms, and ultimately mitigating the effects of global warming. Net primary productivity is very important not only to the health of an ecosystem, but also to the health of the world.
Citations:
"Net Primary Production." UC Davis. Information Center for the Environment, n.d. Web. 02 Oct. 2014. <http://ice.ucdavis.edu/waf/model/indicator/net-primary-production>.
Thorpe, Gary S. "Unit II: The Living World." Barron's AP Environmental Science. Hauppauge, NY: Barron's, 2013. 181. Print.
"What Eats Grass?" What Eats RSS. N.p., 12 Mar. 2010. Web. 05 Oct. 2014. <http://www.whateats.com/what-eats-grass>.
Thorpe, Gary S. "Unit II: The Living World." Barron's AP Environmental Science. Hauppauge, NY: Barron's, 2013. 181. Print.
"What Eats Grass?" What Eats RSS. N.p., 12 Mar. 2010. Web. 05 Oct. 2014. <http://www.whateats.com/what-eats-grass>.
