Collaborators:
Joshua Arteta and Ben Tiffany
Introduction and Problem:
A common method used to determine the population of a species, such as butterfly and fish, in an area is the use of tagging. Scientists utilize tagging to learn about many different species: "birds are banded on their legs, black bears and grizzly bears carry radio transmitters, as do sea turtles. Even monarch butterflies have been banded with delicate mylar patches" (American Littoral Society). According to the background information, by capturing, tagging, and releasing a sample of a species' population, migration patterns, health, range, and most importantly population size of that population can be determined. Through this experiment, the question of how the number of tagged organisms and the number of catches affect the accuracy of tagging in order to determine the population of a species in an area, was addressed.
Hypothesis:
If a random sample of organisms of a species is captured and tagged, then a combination of both a large number of tagged organisms and a large number of catches will yield the most accurate estimate of the size of the species' population.
Parts of the Experiment:
- There is no control group.
- The experimental group consists of every group's fish population.
- The independent variable is the number of tagged organisms and the number of catches.
- A possible confounding variable is the size of the catch samples.
- The dependent variable is the accuracy of the estimate of the size of the species' population.
- The controlled variables are the materials.
Materials:
- random number of white beads
- assigned number of colored beads (10)
- paper bag
Method:
1) Remove a sample catch of 10 fish from the population in the ocean bag.
2) Substitute fish of a different color for each captured fish to represent tagging the captured fish, then return these tagged fish to the ocean bag. Record the original number tagged in the table.
3) Shake the bag and without looking remove a sample catch from the population in the bag. Record the total number of fish caught and the number of tagged fish caught in this sample catch.
4) Repeat this for a total of 10 catches.
5) Calculate the percent tagged for each catch and average that column.
6) Calculate the estimated population size using the formula:
Population Size = Number Tagged / Mean of the Sample Percentages
7) Count the actual population.
8) Calculate the percent error between your estimated population and the actual population.
9) Compare your numbers with those of your classmates to test your hypothesis.
Data Analysis:
Observations

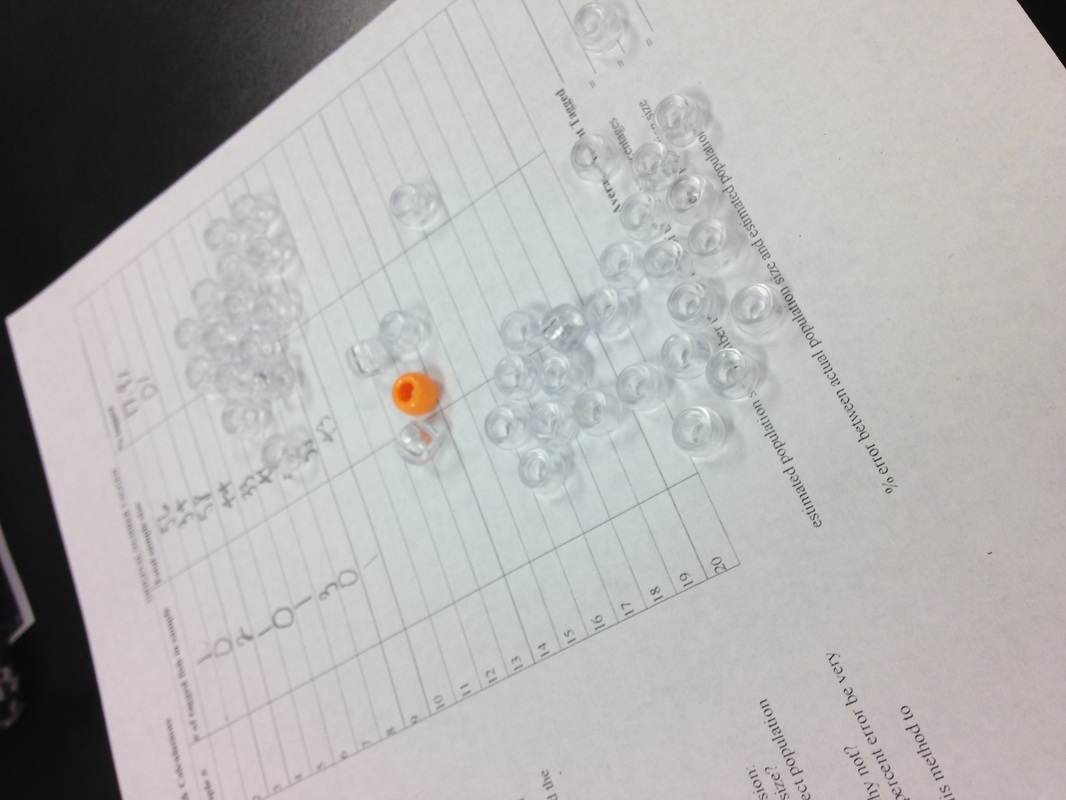
- When the catch size of organisms was small, less tagged organisms appeared (picture 1 and 2).
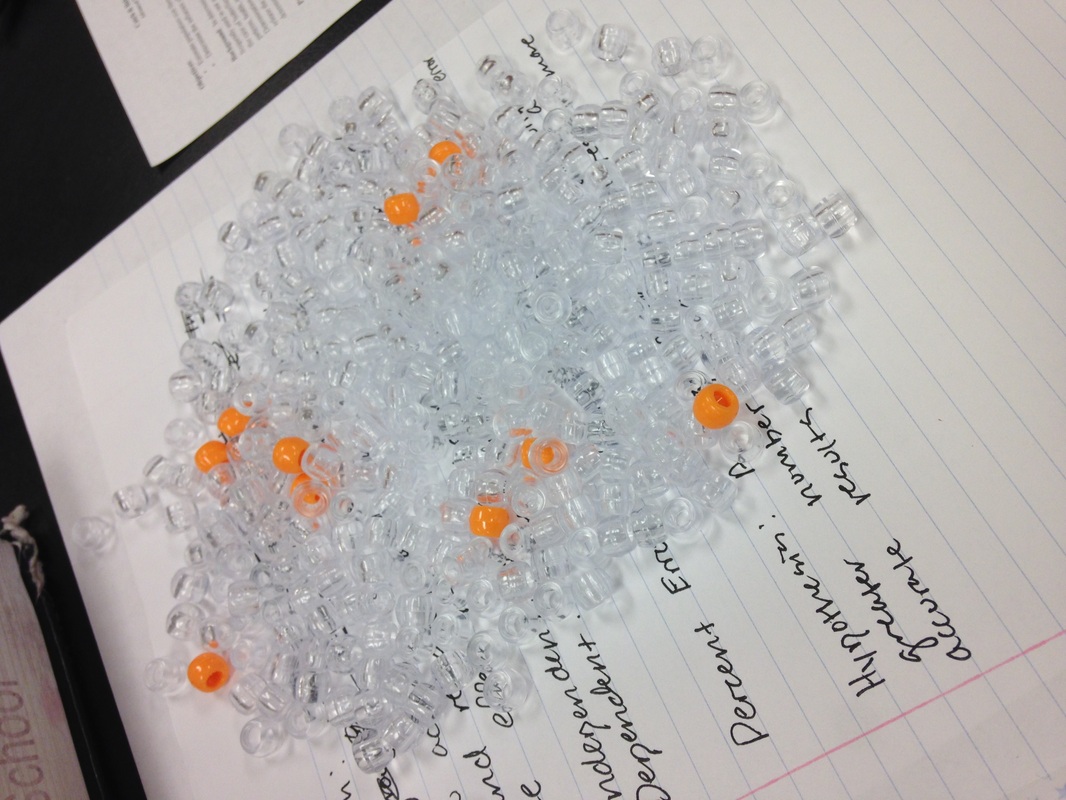
- When the catch size of organisms was large, more tagged organisms appeared (picture 3).
- Due to the small number of tagged organisms, many collected samples contained none, leading to a less accurate calculation of the population's species.
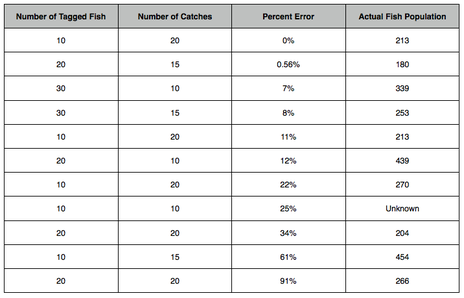
Class Data Table
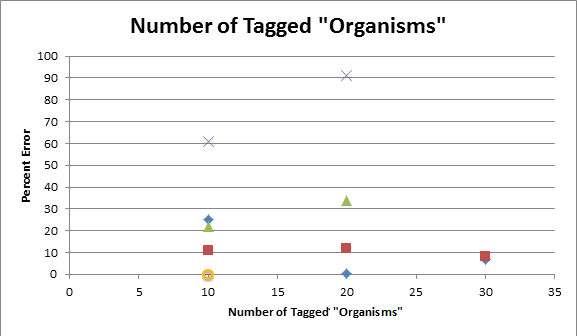
Graphs
|
|
Analysis
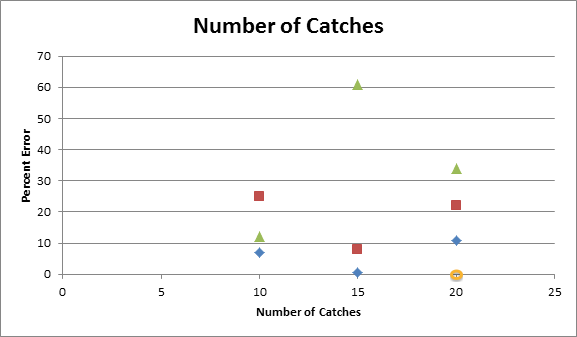
After the class data had been organized using tables and graphs, it was made clear that larger numbers of tagged organisms yield more accurate predictions of the species' population size. The most accurate predictions resulted from groups with a large number of tagged fish; the group with 20 tagged fish and 15 catches had a percent error of 0.56%, while the group with 10 tagged fish and 15 catches had a percent error of 61%. The data also made clear that the number of catches has an insignificant effect on the accuracy of the prediction of the population size. Although both groups had 15 catches, the group with a larger number of tagged fish yielded a more accurate prediction.
Two main outliers are present in the class data: the percent errors of 0% and 91%. These results are not in concordance with the trends of the data: generally, a larger number of tagged organisms yields more accurate predictions of population size. As a result, the outliers were not considered in detail during the analysis of the data.
Two main outliers are present in the class data: the percent errors of 0% and 91%. These results are not in concordance with the trends of the data: generally, a larger number of tagged organisms yields more accurate predictions of population size. As a result, the outliers were not considered in detail during the analysis of the data.
Conclusions:
Conclusion Questions:
1. What could cause the population size estimate to be different from the actual size?
When using the catch and release method to predict population size in an area, there is always a possibility of catching a sample that contains little or none of the tagged organisms; this is especially likely if there is a small number of organisms tagged initially. The opposite, although unlikely, could also happen; all of the tagged organisms could be caught. According to the State University of New York System, an influx of new organisms into an area through birth or immigration, or a large number of organisms who lose their tags could also affect the results. These factors could lead to a skew in the ratio of tagged to untagged organisms, which could ultimately skew the prediction of the population size.
2. How can the size of your catch sample compared to the actual size of the population affect population estimate?
A larger catch sample leads to a more accurate prediction of the actual size of a species' population. For example, in the experiment, when a sample of 33 organisms was caught, none of them were tagged. On the other hand, when a sample of 68 organisms was caught, five of them were tagged. The probability of catching a tagged organism is lower with a small catch sample than with a large catch sample, ultimately skewing the ratio of tagged organisms to untagged organisms. Therefore, a larger catch sample would yield the most accurate predictions of the population size of a species'.
3. How can the number of samples (or catches) affect the results?
In general, a large number of samples leads to more accurate results in any experiment because it leads to a mean that it is more representative to the entire population under study. However, in this experiment, the number of catches did not have a significant impact on the accuracy of the results. The group with 30 tagged fish and only 10 catches yielded was significantly more accurate results than the group with 10 tagged fish and 15 catches; and the group with 20 tagged fish and 20 catches. These data show that the number of tagged organisms plays a more significant role in predicting population size than the number of catches does.
4. Does this method appear to be an effective way to assess population size? Why or why not?
No, this method does not appear to be an effective way to assess population size. A strong correlation does not exist between either of the independent variables (the number of tagged organisms and catch size) and the dependent variable (the accuracy of the results). Groups with the same combination of number of tagged organisms and catch size yielded significantly different percent errors; one group with 20 tagged organisms and 20 catches yielded a percent error of 34%, while another group with the same number of tagged organisms and catches yielded a percent error of 91%. It appears that the disparity between the accuracy between the two groups is likely due to chance variation; the first group might have consistently drawn samples with larger numbers of tagged organisms, while the second group may have drawn smaller numbers of tagged organisms, causing the first group's prediction to be more accurate and the second group's prediction to be an outlier.
5. If you were predicting a large population (like an actual ocean fishery) would your percent error be very large?
Much of the world's fisheries are located in the vast Pacific Ocean. "The area of the Pacific Ocean, without its surrounding seas, is 165 million square kilometers. With the Seas of Japan and Okhotsk, the Bering, Celebes, Coral, East China, Sulu and Yellow Seas, its total area exceeds 179 million square kilometers" (Herbert, Paul). An ocean fishery in the Pacific Ocean would contain a very large number of fish; therefore, if scientists were to use tagging to predict a species' population in a Pacific Ocean fishery, the probability of catching a tagged organism after it is released would be highly improbable. This small likelihood of recapturing tagged organisms would lead to a skew in the calculated ratio between tagged organisms and untagged organisms in the fishery, leading to a very large percent error.
6. What concerns should a biologist have about a species’ habits before (s)he uses this method to approximate the size of a population?
According to the State University of New York System, biologists should take into account the migration patterns of a species before using the catch and release method to approximate the size of its population. For example, if a scientist tags a species of birds near the end of Fall, many of the birds will migrate south to avoid the cold weather. By the time the scientist comes back to gather catch samples, nearly all of the birds would be gone.
Another concern that biologists should take into account is a species' hibernation patterns. Similar to migration, many species, such as bears and hedgehogs, may hibernate during the winter. Therefore, if a biologist tags hedgehogs during the winter to approximate the size of the species' population, his results will be skewed since most of them will be hibernating, and it will be difficult to tag large numbers of them.
Conclusion:
Through this experiment, the hypothesis: "If a random sample of organisms of a species is captured and tagged, then a combination of both a large number of organisms and a large number of catches will yield the most accurate estimate of the size of the species' population", was proven incorrect. According to the class data, the most accurate predictions resulted from groups with a large number of tagged fish; the group with 20 tagged fish and 15 catches had a percent error of 0.56%, while the group with 10 tagged fish and 15 catches had a percent error of 61%. Although both groups had the same number of catches, the first group's percent error was significantly smaller that the second group's. This shows that larger numbers of tagged organisms yield more accurate predictions, but the number of catches has an insignificant effect on the accuracy of the results.
However, the results may have been skewed as a result of a variation of sizes of catch samples among each of the groups. According to the data, one group with 20 tagged organisms and 20 catches yielded a percent error of 34%, while another group with the same number of tagged organisms and catches yielded a percent error of 91%. Although both groups had the same combination of number of tagged organisms and number of catches, there was a large disparity between both groups' percent errors. Another outlier in the data resulted from the group with 10 tagged fish and 20 catches; the group had a percent error of 0%, yielding the most accurate prediction. These results are not in concordance with the trends of the data; although the group only had 10 tagged fish, it yielded the most accurate predictions out of all the groups. A possible explanation for these results is that the more accurate groups may have consistently drawn larger catch samples than the less accurate groups did; because of this, there was a higher probability that the more accurate groups' catch samples would contain tagged organisms, ultimately leading to more accurate results. As a result, the outliers were not considered in detail during the analysis of the class data.
Overall, tagging organisms to determine the population size of a species in an area is not very effective; there is always a possibility for a skew in the data collected due to inconsistent sample sizes, migration, and hibernation (State University of New York System). In order for results to be accurate, scientists must not only tag a large number of organisms, but also take into account these factors.
Citations:
"Estimating Animal Population Size Using Mark-Recapture Techniques." State University of New York System, n.d. Web. 7 Sept. 2014.
Herbert, Paul. "Pacific Ocean." Pacific Ocean. National Council for Science and the Environment, 13 May 2013. Web. 07 Sept. 2014. <http://www.eoearth.org/view/article/155111/>.
"Why Tag Fish?" American Littoral Society. N.p., n.d. Web. 05 Sept. 2014. <http://www.littoralsociety.org/index.php/programs/fish-tagging/why-tag-fish>
