Collaborators:
Joshua Arteta
Introduction and Problem:
Ozone -- a form of oxygen with the chemical formula of O3 -- and particulate matter -- a combination of solid particles and liquid droplets in the air -- are naturally occurring air pollutants. Ozone is naturally produced in the stratosphere, forming the necessary Ozone Layer, while particulate matter is released into the atmosphere from sources such as windblown dust and wildfires. However, anthropogenic activity also releases these air pollutants into the atmosphere: “[Ground level] ozone is formed when pollutants emitted by cars, power plants, industrial boilers, refineries, chemical plants, and other sources chemically react in the presence of sunlight” (Environmental Protection Agency, 2014). Particulate matter, according to the Environmental Protection Agency, is released into the atmosphere from “roadways and dusty industries” (coarse particulate matter), and emitted into the atmosphere by forest fires and formed when air pollutants from anthropogenic sources react with chemicals in the atmosphere (fine particulate matter). Ozone and particulate matter derived from anthropogenic sources are generally the most deleterious to human health.
There exists a plethora of variables that affect the formation of ground level ozone and particulate matter -- cloud cover, thermal inversion, wind, temperature, industries, cars and trucks, off road vehicles, consumer products, and population: Ground level ozone concentrations are highest in the summer; this is because in the summer, there is more sunlight, which provides the energy needed for the chemical reaction producing ozone to occur. In addition, particulate matter concentrations may increase with the presence of winds that carry particulate matter from its source and deposits it in a new location. Through this lab, the problem -- What is the effect of location (and the variables related to location) on ground level ozone and particulate matter concentrations? -- will be addressed.
There exists a plethora of variables that affect the formation of ground level ozone and particulate matter -- cloud cover, thermal inversion, wind, temperature, industries, cars and trucks, off road vehicles, consumer products, and population: Ground level ozone concentrations are highest in the summer; this is because in the summer, there is more sunlight, which provides the energy needed for the chemical reaction producing ozone to occur. In addition, particulate matter concentrations may increase with the presence of winds that carry particulate matter from its source and deposits it in a new location. Through this lab, the problem -- What is the effect of location (and the variables related to location) on ground level ozone and particulate matter concentrations? -- will be addressed.
Pre-Lab
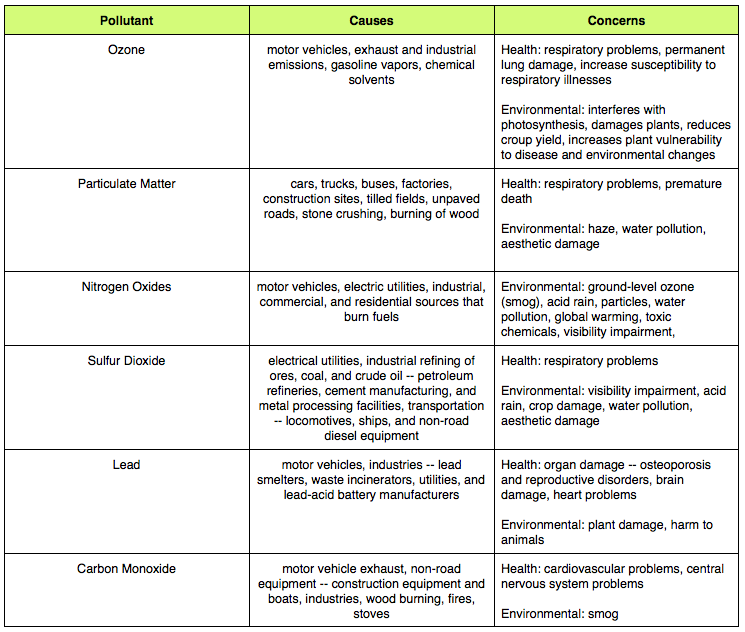
1. Create a chart showing the six air pollutants, causes, and concerns from the information in the pre-lab.
2. Why is ground level ozone highest in the summer and almost nonexistent in the winter? How might this affect our results as we test the air during this part of the year?
Ground level ozone is highest in the summer and almost nonexistent in the winter. This is due to the chemical reaction that produces ozone:
VOC + NOx + Heat + Sunlight --> Ozone. In the summer, there is more heat and sunlight, which provide the energy needed for the chemical reaction to occur, thereby increasing the concentration of ground level ozone. In the winter, however, there is less heat and sunlight, thereby decreasing the concentration of ground level ozone. This may affect our results as we test the air during the winter because there will be a smaller calculated concentration of ground level ozone than there would be if we tested the air during the summer.
3. Many third world countries still use leaded gasoline (since they have older cars or since they have not forced changes). What concerns may the governments of these countries need to deal with?
The governments of third world countries that still use leaded gasoline due to their use of antiquated cars may have to deal with citizens acquiring health problems -- organ damage, reproductive disorders, brain damage, and heart problems -- due to constant exposure to lead. In addition, they may have to deal with environmental problems -- plant damage and harm to animals. As a result, the governments may have to combat these problems by encouraging the use of unleaded gasoline, perhaps by imposing taxes on leaded gasoline and offering subsidies on unleaded gasoline and
environmentally friendly alternatives to gasoline.
4. Use the internet to find what parts of North Carolina are not in compliance with the standards of the Clean Air Act. You may give either general areas or specific counties.
According to the Environmental Protection Agency, as of July 2, 2014, the counties of North Carolina that are not in compliance with the standards of the Clean Air Act are Cabarrus County, Gaston County, Iredell County, Lincoln County, Mecklenburg County, Rowan County, and Union County.
Hypothesis:
If the concentration of ground level ozone in the school parking lot, the cafeteria kitchen, and a petri dish are calculated using the relative humidity and the Schoenbein number measured by ozone monitoring strips, then the order of the locations from greatest to lowest calculated concentration of ground level ozone is the school parking lot, the cafeteria kitchen, and the petri dish.
In addition, if the concentration of particulate matter in the school parking lot, the cafeteria kitchen, and a petri dish are calculated using particulate matter collectors, then the order of the locations from greatest to lowest calculated concentration of particulate matter is the school parking lot, the cafeteria kitchen, and the petri dish.
In addition, if the concentration of particulate matter in the school parking lot, the cafeteria kitchen, and a petri dish are calculated using particulate matter collectors, then the order of the locations from greatest to lowest calculated concentration of particulate matter is the school parking lot, the cafeteria kitchen, and the petri dish.
Parts of the Experiment:
- The independent variable consisted of the location in which the ozone monitoring strips and the particulate matter collectors are placed.
- The dependent variable consisted of the ground level ozone concentration and the particulate matter concentration of the different locations.
- The controlled variables consisted of materials, the day on which the samples were placed in their locations, and the day on which the samples were collected from their locations.
- The experimental group consisted of the ozone monitoring strips and the particulate matter collectors that are placed in the school parking lot and the cafeteria kitchen.
- The control group consisted of the ozone monitoring strips and the particulate matter collectors that are placed in the petri dish.
Materials:
- potassium iodide
- corn starch
- filter paper
- index card
- string
- petroleum jelly
- q-tips
- microscopes
- Schoenbein Number chart
- relative humidity Schoenbein Number Chart
- particulate matter figure
Method:
1. Receive one petri dish containing one ozone monitoring strip, and one petri dish containing one particulate matter collector from the teacher.
2. Prepare two more ozone monitoring strips and two more particulate matter collectors: Smear petroleum jelly on two filter papers and two index cards. Tie a piece of string to each filter paper and index card.
3. Tie each filter paper and index card in its location (Tie one filter paper and index card to a tree in the parking lot, and the others in the cafeteria kitchen).
4. Leave the filter papers and index cards in their locations for one day.
5. Return to the locations of the filter papers and index cards and bring them back to the classroom.
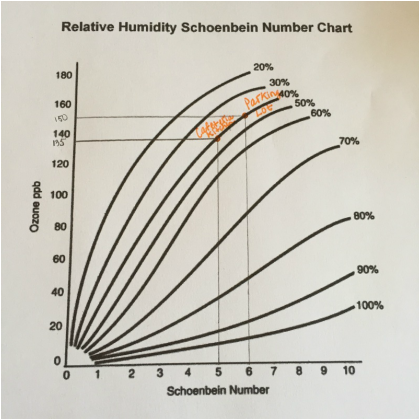
6. Dunk each filter paper into distilled water and use the Schoenbein Number chart to determine the Schoenbein Number of each filter paper. Use the relative humidity of the day that the filter papers were placed in their locations, and the Schoenbein number to calculate the concentration of ground level ozone using the chart provided in the lab.
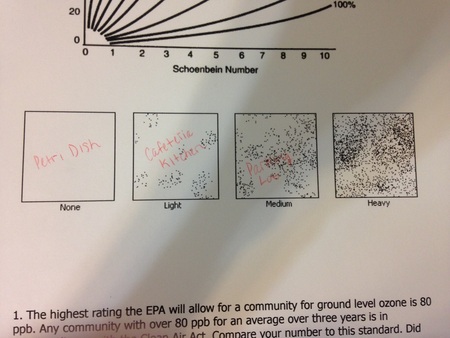
7. Examine the particulate matter slides under a microscope and determine the amount of particles using the figure provided in the lab. In addition, estimate the source of the PM and classify the PM.
8. Record data on a data table.
2. Prepare two more ozone monitoring strips and two more particulate matter collectors: Smear petroleum jelly on two filter papers and two index cards. Tie a piece of string to each filter paper and index card.
3. Tie each filter paper and index card in its location (Tie one filter paper and index card to a tree in the parking lot, and the others in the cafeteria kitchen).
4. Leave the filter papers and index cards in their locations for one day.
5. Return to the locations of the filter papers and index cards and bring them back to the classroom.
6. Dunk each filter paper into distilled water and use the Schoenbein Number chart to determine the Schoenbein Number of each filter paper. Use the relative humidity of the day that the filter papers were placed in their locations, and the Schoenbein number to calculate the concentration of ground level ozone using the chart provided in the lab.
7. Examine the particulate matter slides under a microscope and determine the amount of particles using the figure provided in the lab. In addition, estimate the source of the PM and classify the PM.
8. Record data on a data table.
Data:
Schoenbein Number Chart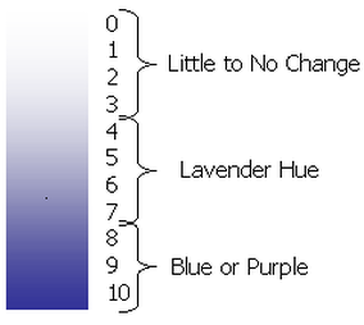
|
|
Particulate Matter Figure
Pictures |
Data Table and Analysis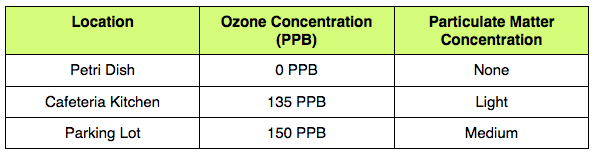
By using the relative humidity of the day that the filter papers were placed in their locations (40%), the Schoenbein number, and the chart provided in the lab, we successfully calculated the approximate ground level ozone concentration of each location: Petri dish (control) - 0 PPB, cafeteria kitchen (135 PPB), parking lot (150 PPB). The petri dish had the lowest ground level ozone concentration, while the parking lot had the highest.
In addition, by examining the particulate matter slides under a microscope and using the figure provided in the lab, we successfully determined the relative particulate matter concentration of each location: Petri dish (control) -- none, cafeteria kitchen -- light, parking lot -- medium. The petri dish had the lowest particulate matter concentration, while the parking lot had the highest. |
Conclusion:
Conclusion Questions
1. The highest rating the EPA will allow for a community for ground level ozone is 80 PPB. Any community with over 80 PPB for an average over three years is in noncompliance with the Clean Air Act. Compare your number to this standard. Did Wake Forest meet the standard on this day? Using what you know about the formation of ozone, decide if you believe the measurement you made was an accurate measurement of the air quality and why.
Compared to the Environmental Protection Agency’s standard for ground level ozone concentration, 80 PPB, the ground level ozone concentration of the cafeteria kitchen during the day on which the lab was conducted was 55 PPB greater, while that of the parking lot was 70 PPB more. Based on the data alone, Wake Forest did not meet the standard on that day; however, the ground level ozone concentration of a city on a single day cannot be generalized to describe the normal air quality of that city for an extended period of time, for there are many variables that affect ground ozone level concentrations: Firstly, the lab was conducted during the winter, the season of the year in which there is less sunlight, and therefore less ground ozone in the atmosphere due to the chemical reaction that produces ozone. In addition, the highest calculated ground level ozone concentration came from the parking lot, an area with a lot of nitrogen oxide emissions -- a reactant that produces ozone -- from students’ cars and trucks; therefore the calculated ground level ozone concentration in the parking lot will be higher than that of an area of Wake Forest with little cars and trucks. In order to achieve accurate measurements of the air quality of a city, one must calculate the ground level ozone of different seasons as well as areas in order to compensate for the myriad of variables surrounding air quality.
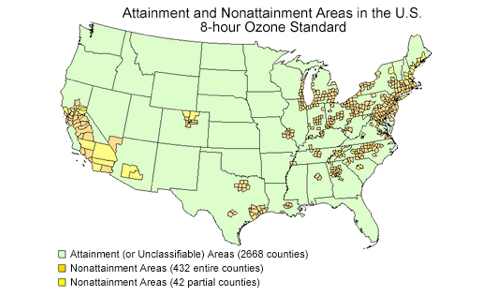
2. 13% of counties in the US are not meeting the Ozone requirements of the Clean Air Act. Use the chart below and information from class to explain the reason for the location of the counties in Non-attainment.
Based on the chart below as well as concepts learned in class, the location of the non-attainment areas in the United States are affected by the weather and climate of those areas. Firstly, in states that experience dry climates and frequent and long droughts, such as California, there is more sunlight, which provides the energy needed for the chemical reaction producing ozone to occur, thereby increasing ground level ozone concentrations. In addition, according to concepts learned in Honors American History, the Northeast already has a large number of industries; however, according to concepts learned in AP Environmental Science, prevailing winds carry primary and secondary air pollutants from the West to the East, thereby expediting air pollution in the East. Weather and climate have a significant effect on the location of air pollution in the United States.
Compared to the Environmental Protection Agency’s standard for ground level ozone concentration, 80 PPB, the ground level ozone concentration of the cafeteria kitchen during the day on which the lab was conducted was 55 PPB greater, while that of the parking lot was 70 PPB more. Based on the data alone, Wake Forest did not meet the standard on that day; however, the ground level ozone concentration of a city on a single day cannot be generalized to describe the normal air quality of that city for an extended period of time, for there are many variables that affect ground ozone level concentrations: Firstly, the lab was conducted during the winter, the season of the year in which there is less sunlight, and therefore less ground ozone in the atmosphere due to the chemical reaction that produces ozone. In addition, the highest calculated ground level ozone concentration came from the parking lot, an area with a lot of nitrogen oxide emissions -- a reactant that produces ozone -- from students’ cars and trucks; therefore the calculated ground level ozone concentration in the parking lot will be higher than that of an area of Wake Forest with little cars and trucks. In order to achieve accurate measurements of the air quality of a city, one must calculate the ground level ozone of different seasons as well as areas in order to compensate for the myriad of variables surrounding air quality.
2. 13% of counties in the US are not meeting the Ozone requirements of the Clean Air Act. Use the chart below and information from class to explain the reason for the location of the counties in Non-attainment.
Based on the chart below as well as concepts learned in class, the location of the non-attainment areas in the United States are affected by the weather and climate of those areas. Firstly, in states that experience dry climates and frequent and long droughts, such as California, there is more sunlight, which provides the energy needed for the chemical reaction producing ozone to occur, thereby increasing ground level ozone concentrations. In addition, according to concepts learned in Honors American History, the Northeast already has a large number of industries; however, according to concepts learned in AP Environmental Science, prevailing winds carry primary and secondary air pollutants from the West to the East, thereby expediting air pollution in the East. Weather and climate have a significant effect on the location of air pollution in the United States.
3. Particulate matter has recently been added to the requirements of the Clean Air Act. Theorize reasons that it was not part of the act until the 1990’s.
Particulate matter was only recently added to the air quality requirements of the Clean Air Act by the Environmental Protection Agency because before the 1990’s, the agency was not cognizant of the harmful effects of airborne particles due to their small size. However, as technology -- for example microscopes -- advanced, scientists were able to examine particulate matter, realizing that it does have a deleterious effect on public health.
4. Compare and contrast the different PM samples – did they meet your expectations? Why or why not?
The results of the lab met my expectations: According to the data table, the petri dish (control) sample had no particulate matter; the cafeteria kitchen sample and the parking lot sample both had particulate matter; however, the former had a light amount of particulate matter, while the latter had a medium amount of particulate matter. According to Chao, this is due to particulate matter released from the gas and electric burners found in the cafeteria kitchen: “[These] burners produce particles essentially by volatilizing dust”. She compares the process to a the toasting of toast using a toaster: “If you haven’t used [your toaster] for awhile, after you turn it on, you can smell ... chemicals that have been volatilized. Once they’re in the air, they recondense into these ultrafine particles” (Chao, n.d.). On the other hand, fuel-powered vehicles, especially diesel-fueled vehicles, produce and release particulate matter into the atmosphere -- which are composed of many different chemical elements, such as sulfate, ammonium, nitrate, carbon, arsenic, selenium, cadmium, and zinc. As a result, although both the parking lot sample and cafeteria kitchen sample had particulate matter, the former had a larger amount of particulate matter than the latter.
5. Explain why air quality monitoring is important for the health of the economy.
According to the Environmental Protection Agency, the Clean Air Act has led to economic prosperity in recent years: The United States environmental protection technologies industry, [which includes all environmental media, environmental cleanup, and resource recovery,] by 2007, “was generating approximately $282 billion in revenues, producing $40 billion in exports, and supporting 1.6 million jobs” (Environmental Protection Agency, 2013). In addition, due to the deleterious effects of air pollutants, such as ozone and particulate matter, on public health, a proliferation in air pollution can lead to a significant attrition in the number of workers, which presents negative effects on the economy. Finally, air pollutants, such as sulfur dioxide, can produce acid rain, which kills vegetation, leading to decreased crop yields, and ultimately harming the agricultural industry. Air quality monitoring precludes not only harmful effects on the environment, but also the economy.
General Conclusions
The results of the experiment corroborated the Hypothesis -- “If the concentration of ground level ozone and particulate matter are measured in a petri dish, the cafeteria kitchen, and the school parking lot, then the petri dish sample will have the lowest concentrations of each air pollutant, while the parking lot sample will have the highest concentrations of each air pollutant”. By using the Schoenbein Number chart and relative humidity Schoenbein Number chart, as well as the relative humidity of the day on which the experiment was conducted, it is evident that the petri dish sample had a ozone concentration of 0 PPB, the cafeteria kitchen sample had an ozone concentration of 135 PPB, and the parking lot sample had an ozone concentration of 150 PPB. In addition, by using the particulate matter figure, it is evident that the petri dish sample had no particulate matter, the cafeteria kitchen sample had a light amount of particulate matter, and the parking lot sample had a medium amount of particulate matter.
The results of the experiment strongly substantiate the existence of a strong cause and effect relationship between location (and the variables related to location) and ground level ozone and particulate matter concentrations. The petri dish sample had no ground level ozone or particulate matter. This is because the air contained inside the petri dish was not exposed to any nitrogen oxides, volatile organic compounds, or particles; as a result, the no chemical reactions took place to produce the air pollutants -- ozone and particulate matter.
On the other hand, the cafeteria kitchen sample had an ozone concentration of 135 PPB, which does not meet the Environmental Protection Agency's standard for ground level ozone, and a light amount of particulate matter. According to Chao, this is most likely due to the cooking burners used to prepare lunch for students: Gas burners, especially, emit nitrogen dioxide into the air, which is one of the chemical precursors of ozone. The nitrogen dioxide may have reacted with volatile organic compounds, which are ubiquitous in a school environment -- adhesives, paints, air fresheners, cleaning and disinfecting chemicals, fuel oil, and stoves -- in the presence of sunlight to produce a moderate level of ozone. In addition, particulate matter is released from the gas and electric burners found in the cafeteria kitchen: “[These] burners produce particles essentially by volatilizing dust”. She compares the process to a the toasting of toast using a toaster: “If you haven’t used [your toaster] for awhile, after you turn it on, you can smell ... chemicals that have been volatilized. Once they’re in the air, they recondense into these ultrafine particles” (Chao, 2013).
Finally, the parking lot sample had an ozone concentration of 150 PPB, which does not meet the Environmental Protection Agency's standard for ground level ozone and is 15 higher than that of the cafeteria kitchen sample, and a medium amount of particulate matter. According to the Union of Concerned Scientists, this is most likely due to the large number of fuel-powered vehicles, especially diesel-fueled vehicles, releasing nitrogen oxides into the atmosphere through the burning of fuel, which then react with volatile organic compounds in the presence of sunlight to produce a high level of ozone. In addition, these cars and trucks produce and release sulfate, ammonium, nitrate, carbon, arsenic, selenium, cadmium, and zinc -- chemical elements that form particulate matter in the atmosphere. In addition, wind carries particulate matter -- dust and dirt -- from nearby areas, such as the playing field, to the parking lot.
Although the weather on the day on which the experiment was conducted may have affected the ground level ozone concentrations, the results of the experiment still reiterate an important concept: Although ozone and particulate matter are naturally occurring air pollutants, human-related activities, such as driving fuel-powered vehicles, using consumer products, and even cooking with gas burners, can exacerbate the current state of the atmosphere, leading to deleterious effects on public health -- mainly respiratory problems. In recent years, however, the Clean Air Act -- a federal law that serves to protect public health by regulating emissions of air pollutants from stationary and mobile sources -- has “improved [ozone air quality] in 95 of the 126 areas designated to be in nonattainment for the ozone air quality standards”. In addition, the act is predicted to “prevent more than 160,000 premature deaths ... [and cause the] economic value of the air quality improvements ... to reach almost $2 trillion for the year 2120” (Environmental Protection Agency, 2013). The statistics demonstrate that it is not too late for humans to make a positive change in the environment, and reiterates an important concept in environmental science: The prevention of pollution is much more manageable than the clean-up of it. As humans, we must protect our most important commons, the atmosphere.
Citations:
Chao, Julie. "Pollution in the Home: Kitchens Can Produce Hazardous Levels of Indoor Pollutants." Berkley Lab. University of California, 23 July 2013. Web. 13 Dec. 2014. <https://newscenter.lbl.gov/2013/07/23/kitchens-can-produce-hazardous-levels-of-indoor-pollutants/>.
"Current Nonattainment Counties for All Criteria Pollutants." EPA. Environmental Protection Agency, 2 July 2014. Web. 4 Dec. 2014. <http://www.epa.gov/oaqps001/greenbk/ancl.html>.
"Diesel Engines and Public Health." Union of Concerned Scientists. N.p., n.d. Web. 13 Dec. 2014. <http://www.ucsusa.org/clean_vehicles/why-clean-cars/air-pollution-and-health/trucks-buses-and-other-commercial-vehicles/diesel-engines-and-public.html#.VIvkNGTF_50>.
"Ground Level Ozone." EPA. Environmental Protection Agency, 1 Dec. 2014. Web. 09 Dec. 2014. <http://www.epa.gov/groundlevelozone/>.
"Particulate Matter." EPA. Environmental Protection Agency, 18 Mar. 2013. Web. 10 Dec. 2014. <http://www.epa.gov/pm/>.
